
European Regional Economic Integration and Foreign Direct Investment
Volume 10 | Número 98 | Abr. 2023

Por José Paulo Silva Ferreira
ABSTRACT
It is commonly conceived in the International Relations literature that regional integration enhances the entry of foreign direct investments, due to trade liberalization and the fall of protectionism. In this sense, this article seeks to verify whether joining the European Union puts pressure on investment entry. To this end, data from the UNCTADstat platform was analyzed, which revealed inconsistency of the aforementioned assumption regarding the European experience.
Keywords: Regional Integration; European Union; Foreign Direct Investment.
INTRODUCTION
Regional integration is one of the central processes of modern globalization dynamics and of the multilateral trading system. Regionalization processes are currently underway in different regions of the world, enabling costly divisions in trade of goods and services to be overcomed, in addition to facilitating capital flows and the outsourcing of productive capacities. As these efforts impact trade and investment dynamics through market liberalization, they could put pressure on opening up different economic sectors, just as enabling the inflow of foreign direct investment — international capital mobility by companies or individuals for specific investment proposals1.
The prime example of regional integration, and maybe the most successful one, is the process of integration in the European continent, which started from the concern of rebuilding the economies devastated by World War II, and led in 1993 to the founding of the European Union. Due to its particularities, the European integration currently represents a model with unique integration characteristics (ALMEIDA, 2013).
In the light of presented information, this article takes as its guiding question if joining the European Union increases the attraction of foreign direct investment. The independent or explanatory variable is, in general terms, the regional integration process, and is specifically the European regional economic integration, within the scope of the European Union. The dependent variable corresponds to the increase of foreign direct investment inflow. The hypothesis is that upon joining the European Union, new members undergo adjustments that imply trade liberalization, fiscal policies standardization and fall of protectionism, which results in an inward pressure of foreign direct investment. The object of study is the implications of regional integration.
The European Union is currently made up of 27 states, that despite standardizing a bunch of practices and common institutions, they do not form a homogeneous block when the subject is investment attraction among its members (UNCTAD, 2012). Therefore, there are comparative advantages that impact in capitals inflow and outflow. Seeking to carry out an empirical analysis of the proposed research problem, it is primarily needed to isolate the variables. It means that the analysis should focus on countries that share similar backgrounds, mainly about investment attraction.
The proposed spatial scope is the post-soviet east european countries. Firstly, as post-soviet republics or Newly Independent States, these countries have a set of traits in common, not only in its geographical and cultural aspects, but also in socioeconomic terms, as they were submitted a bit more than three decades ago to the decisions of a central government (BARTLETT, 2001). Russia is excluded for the comparative analysis, as it is a middle power with greater resources for projecting political and economic capabilities, thus holding many deviations to the other states. In addition, Russia did not engage in the European economic integration dynamic. Countries such as Kazakhstan, Kyrgyzstan, Tajikistan, Turkmenistan and Uzbekistan, although were also part of the Soviet Bloc, are excluded from the analysis for geographical reasons, not being able to join the European regional integration process, and for being influenced by other poles of economic power, or being in overlapping influence projection areas of the European Union, Russia and China (RUMER, 2006). An example is that among the mentioned countries all except Turkmenistan are members of the Shanghai Cooperation Organization.
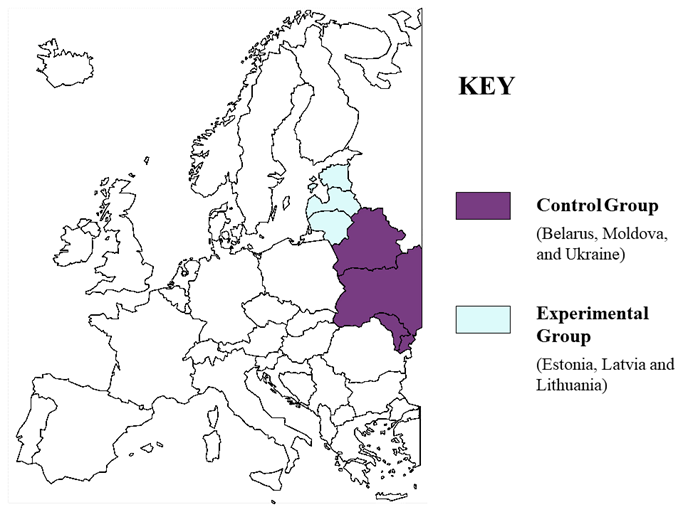
Secondly, the spatial scope excludes the other eastern European countries for being closely related to other areas than Post-Soviet East Europe, for instance, some of these states made up the Yugoslavia2. In this way, the experimental group comprises the former Soviet republics of Eastern Europe that joined the European Union – Estonia, Latvia and Lithuania –, and the control group is composed of the former Soviet republics of Eastern Europe that did not join – Belarus, Moldova and Ukraine. The three states in the experimental group also have the common fact of joining the bloc in the same year, during the 2004 Enlargement of the European Union – the moment of greater simultaneous accessions of new members. So, 1994 to 2014 was chosen as the time frame for data analysis, that is, a decade before and another one after joining in May 2004, providing a historical series.
In order to clarify the proposed question, this article is organized as follows: the first section presents a brief literature review regarding the mainstream assumptions in International Relations on motivations for foreign direct investment; the second section brings data from UNCTADstat – a database maintained by the United Nations Conference on Trade and Development – to identify changes in investments in the proposed framework; and the last section presents considerations based on the mentioned literature and data, seeking hypothesis test, as well as suggests paths for further researches.
LITERATURE REVIEW
The Eclectic Paradigm or Ownership-Location-Internalization Framework (OLI Framework), is based on the research of Dunning (1977; 1980; 1988) and seeks to clarify companies internationalization processes, which tends to be characterized by three types of advantages that explain foreign direct investment. This has traditionally been the approach used to analyze investment flows, which carries out from the perspective of the firms (CARNEIRO; DIB, 2007). Nevertheless, despite its explanatory potential for individual companies, the Eclectic Paradigm has been unable to explain macroeconomic investment trends, mainly since the 1970s, like the increase of investments among industrial nations, concurrently with the fall of trade barriers, as well as, it has disregarded the effects of regional integration on investment flows (BRENTON et al., 1999, p. 97).
There are different ways for firms to enter into foreign markets – among the most common, one could mention: acquisition, strategic alliances, exports, franchises, greenfield investments, joint ventures, and licenses. Not all internationalization approaches are suitable for all companies, thereby, the Eclectic Paradigm is an attempt to narrow which would be the most appropriate paths. Each enterprise profile within the ownership, location and internalization criterias, points out to the most appropriate strategies for outsourcing capabilities, and a balanced mix of the three factors makes it possible to successfully engage in foreign direct investment. Within the proposed paradigm, competitive advantages may develop from the ownership of unique intangible assets, such as the domain of an exclusive technology, or from the ownership of complementary assets, such as the capability to develop new technologies (CARNEIRO; DIB, 2007; VIANNA; ALMEIDA, 2012).
Firstly, the rewards of ownership concern proprietary information, such as: brand, copyright, patent rights, trademark and skills internally available. Therefore, these are intangible advantages. Companies with a brand that has a high reputation and unique technological capabilities have high rewards of ownership. Secondly, the location advantages can be due both to a privileged location in a geographical context – for instance, a coast line – or other factors, such as the availability of closeness to strategic regions in production chains, cheap raw materials, lack of tariffs, low wages, special taxes, skilled labor force, the use of the same language etc. Access to these resources, which are fixed, usually requires partnerships with foreign investors. Finally, the internalization advantages signal capabilities to master the production stages, in other words, the firm has such a level of technological development that it becomes more economical to involve less third party actors than its leading business competitors. This advantage can be marked by arrangements like joint ventures, local companies acquisition and greenfield investments (CARNEIRO; DIB, 2007; VIANNA; ALMEIDA, 2012).
The following section aims to fill the explanatory gap indicated by Brenton et al. (1999) about the Eclectic Paradigm. This internationalization theory explains well the performance of individual business, but shows difficulties in attributing macroeconomic issues such as regional economic integration.
METHOD AND DATA
This section explains how data was extracted and handled. As previously discussed, the experimental and control groups are geographically distributed as shown in the map below:
Map 1 – Post-Soviet Republics of Eastern Europe
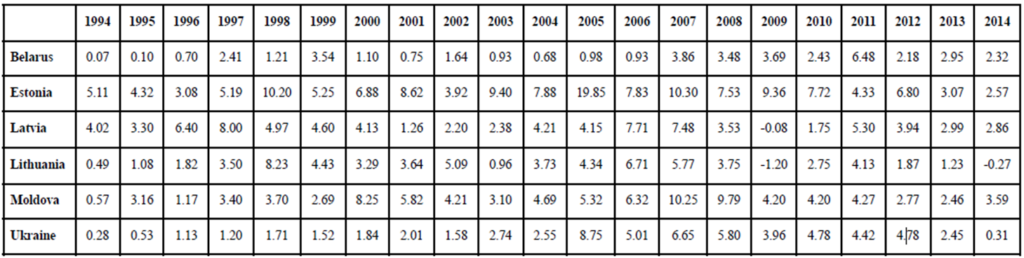
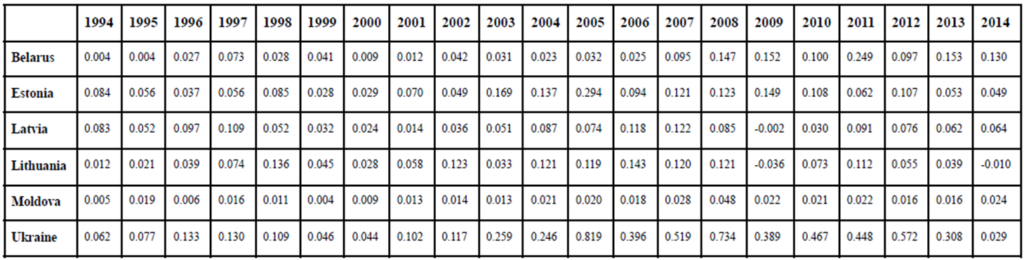
The data selected for this article was extracted from the UNCTADstat online dababase. When filtering data it has been chosen foreign direct investment inflow, at the spatial and time frameworks specified above. Next, two different measures were considered: firstly, the percentage of foreign direct investment in relation to the Gross Domestic Product (GDP) – Annex A; secondly, the percentage of local foreign direct investment in relation to global overall investments – Annex B.
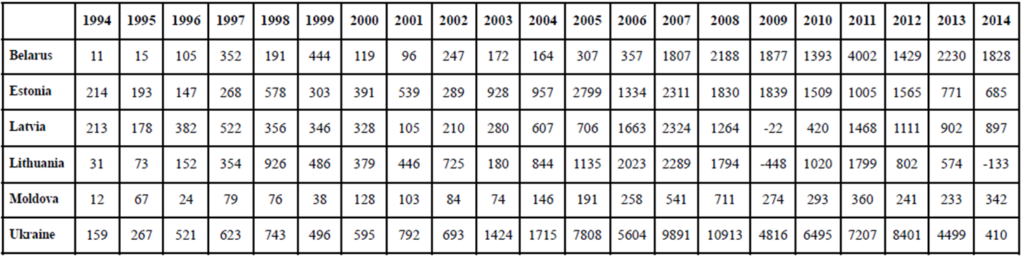
The first measure is given in relative and not absolute terms, so that one can identify how relevant foreign investments are for a given economy. For instance, consider that in the historical series, one of the countries has a nominal drop in investment inflows, however, this fall was followed by a proportionally greater reduction in the GDP. In this way, although the investments have nominally reduced, in fact they have become more relevant. Nonetheless, seeking scientific transparency regarding the data, the nominal amounts of foreign direct investment in millions of dollars are available in Annex C. Regarding the second measure, foreign direct investment is considered in relation to global overall investments to verify whether the regional economic integration process implies an increase of investment flows in Europe, compared to the rest of the world.
To carry out the comparative analysis between the experimental group and the control group, it was decided to overlap two trend curves, utilizing simple arithmetic averages. Thus, Graph 1 presents the trend curves for foreign direct investment in relation to the GDP, for both groups. In Graph 2, the curves indicate if there are changes in the inflow of investments considering the global context, that is, makes possible to identify periods of international recession, which impact on the allocation of investments, enabling to comprehend whether regional integration was considered a preferential asset. In addition, it enables one to understand how significant investments became for these countries in the international context after joining the European Union.
Graph 1 – Foreign Direct Investment from selected countries in relation to GDP (%)
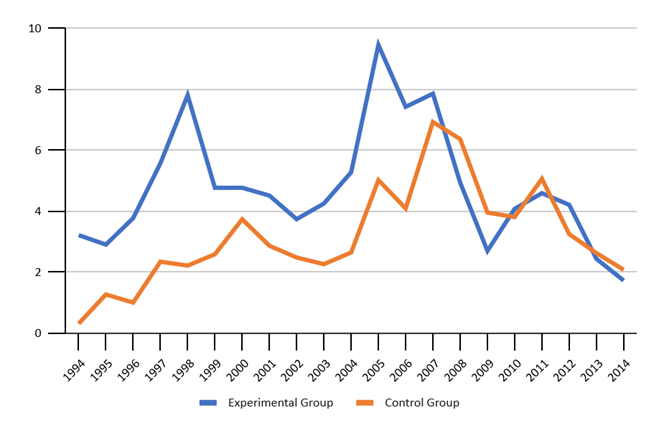
It can be asserted, as shown in Graph 1, that the countries in the experimental group, even before joining the European Union, in May 2004, already had a considerable advantage regarding investments inflow. The situation only started to change in 2008, while for the experimental group foreign investments represented 4.93% of GDP, for the control group it became 6.35% (UNCTAD, 2023) — this change was potentially due to the effects of the Subprime Crisis, as well as the fluctuations in later years may be a result of the crisis recovery period (STODDARD; NOY, 2015). In any case, since 2008 there has been an absolute drop in foreign direct investment for all countries analyzed. 2009 was the year with the greatest relative advantage for the control group. Between 2010 and 2013 the values remain balanced, with slight alternation between groups (UNCTAD, 2023). Another factor that may have influenced these variations, specifically in 2014, was the regional instability caused by the Russian military occupation within Crimea (STODDARD; NOY, 2015).
Graph 2 – Foreign Direct Investment from selected countries in relation to global overall investments (%)
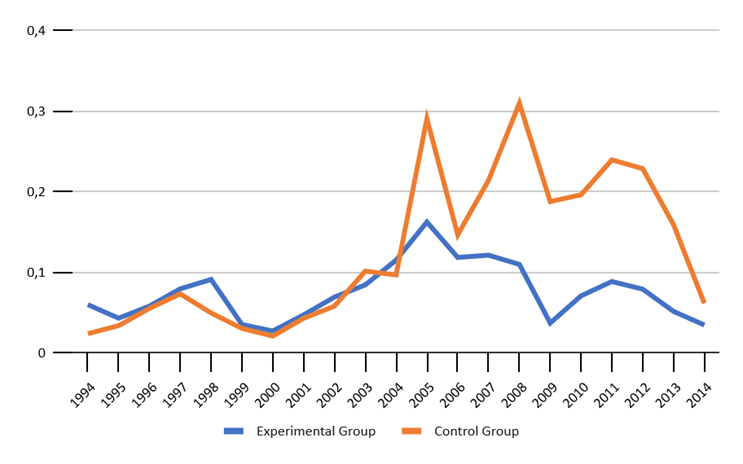
By means of the Graph 2, one can check that investments in the countries of the analyzed region — that is, adding the experimental and control groups — do not exceed 0.5% of global investment flows, in the time frame covered. Therefore, the analyzed countries comprise an area of little relevance in attracting investments in the global context and in Europe itself. Both groups held, in relative terms, very similar values until 2005, when the control group surpassed the experimental one, maintaining the advantage since then, with closeness between the groups in 2006 and 2009 (UNCTAD, 2023). The 2010 Greek Financial Crisis is another factor which impacted on both graphs (STODDARD; NOY, 2015).
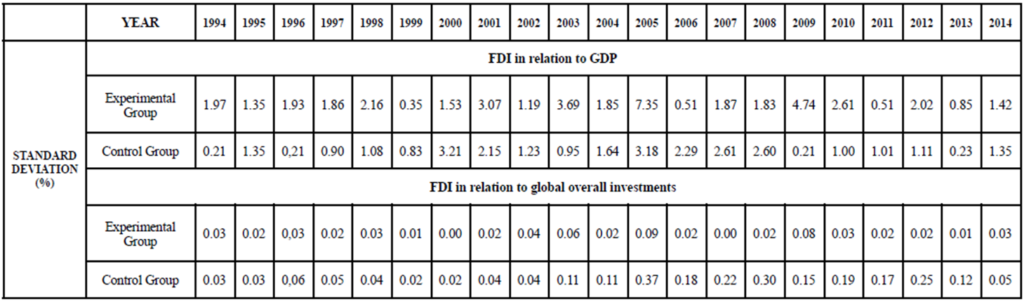
To assess the reliability of the sample data in indicating trends, the standard deviation was also measured — Annex D —, indicating how homogeneous the dataset is. This dispersion measure makes it possible, for instance, to identify atypical values among the data, which may interfere with the interpretation of the results. Thus, in order to identify reliable trends, it ideally should be close to zero. As for the measure of foreign direct investment in relation to GDP, it can be observed that the standard deviation tended to be from 1 to 2% in most of the period, but the main discrepancy was 2005, with more than 7%. Concerning foreign direct investment in relation to global investments, it tends to zero throughout the period (UNCTAD, 2023).
CONCLUSION AND DISCUSSION
It is commonly attributed to the regional economic integration process — through the opening of markets and liberalization of investments — as a stimulus to the entry of foreign direct investment (ALMEIDA, 2013). However, given the analyzed data, the hypothesis was not confirmed regarding the experience of the European Union (UNCTAD, 2023). This does not necessarily mean that regional integration does not boost investments, but that in the case of the European continent, other factors may have been of greater relevance. For instance, foreign investment pressures are present in Eastern Europe due to Russian foreign economic policy priorities (RUMER, 2006).
Lastly, it is proposed for future research to analyze the entry of foreign investments in areas of consolidated integration, but which have fewer intervening variables than Europe. The Southern African Development Community (SADC) and the Community of Latin American and Caribbean States (CELAC) stand out as possibilities.
REFERENCES
ALMEIDA, P. R. Integração regional: uma introdução. São Paulo: Saraiva, 2013.
BARTLETT, D. Economic Development in the Newly Independent States: The Case for Regionalism. The European Journal of Development Research. Germany, v. 13, p. 135-153, 2001. Available at: https://doi.org/10.1080/09578810108426784. Accessed on: 15 jan. 2023.
BRENTON, P. et al. Economic Integration and FDI: An Empirical Analysis of Foreign Investment in the EU and in Central and Eastern Europe. Empirica: Journal of European Economics. Netherlands, 1999. Available at: https://link.springer.com/article/10.1023/A:1007006429600. Accessed on: 15 jan. 2023.
CARNEIRO, J.; DIB, L. A. Avaliação comparativa do escopo descritivo e explanatório dos principais modelos de internacionalização de empresas. Internext: Revista Eletrônica de Negócios Internacionais. São Paulo, v. 2, n. 1, p. 1-25, 2007. Available at: https://internext.espm.br/internext/article/view/46. Accessed on: 30 jan. 2023.
DUNNING, J. The eclectic paradigm of international production: a restatement and some possible extensions. Journal of International Business Studies, v. 19, n. 1, p.1-31, 1988.
DUNNING, J. Toward an eclectic theory of international production: some empirical tests. Journal of International Business Studies, v. 2, n. 3, p. 9-31, 1980.
DUNNING, J. Trade, location of economic activity, and the multinational enterprise: a search for an eclectic approach. In: OHLIN, B. et al. (ed.) The international allocation of economic activity. London: Macmillan, 1977.
RUMER, E. China, Russia and the Balance of Power in Central Asia. Washington, D.C.: Strategic Forum: National Defense University, 2006.
STODDARD, O.; NOY, I. Fire-sale FDI? The Impact of Financial Crises on Foreign Direct Investment. Review of Development Economics. United Kingdom, v. 19, n. 2, p. 387-399, 2015. Available at: https://doi.org/10.1111/rode.12149. Accessed on: 12 jan. 2023.
UNCTAD. United Nations Conference on Trade and Development Secretariat. Regional integration and foreign direct investment in developing and transition economies. Geneva, 2012. Official Report. Available at: https://digitallibrary.un.org/record/739423. Accessed on: 4 jan. 2023.
UNCTAD. UNCTADstat: Foreign direct investment – Inward and outward flows and stock, annual. Geneva: United Nations Conference on Trade and Development, 2023. Online database. Available at: https://unctadstat.unctad.org/wds/TableViewer/tableView.aspx. Accessed on: 2 jan. 2023.
VIANNA, N.; ALMEIDA, S. A decisão de internacionalizar. Internext: Revista Eletrônica de Negócios Internacionais. São Paulo, v. 6, n. 2, p. 1-21, jul. – dez. 2011. Available at: https://internext.espm.br/internext/article/view/121. Accessed on: 30 jan. 2023.
ANNEX A — FDI IN RELATION TO THE GDP (%)
ANNEX B — LOCAL FDI IN RELATION TO GLOBAL OVERALL INVESTMENTS (%)
ANNEX C — NOMINAL FDI (USD AT CURRENT PRICE IN MILLIONS)
ANNEX D — STANDARD DEVIATION OF FDI MEASURES OF SELECTED COUNTRIES (%)
Paulo Silva Ferreira Master’s student in Political Science (CAPES Fellowship), in the field of International Politics, and Bachelor in International Relations at the Federal University of Goiás (UFG). Assistant Researcher at the Center for Global Studies (NEG-UFG), with an emphasis on Political Economy.
Como citar:
FERREIRA, José Paulo Silva. European Regional Economic Integration and Foreign Direct Investment. Diálogos Internacionais, Volume 10 | Número 98 | Abr. 2023. Disponível em: https://dialogosinternacionais.com.br/?p=2869
Notas de rodapé
- Foreign direct investment is a kind of cross-border investment in which a businessperson establishes a long lasting interest regarding a foreign economy, besides of a relevant degree of influence over a foreign enterprise. The foreign direct investments can be further characterized in four modalities as follows: horizontal, vertical, conglomerate and platform. These are all branches of the main definition. Taking into account the purpose of this paper, the general concept, as defined, is the one considered.
- Countries like the former East Germany, Czechoslovakia, Hungary, Romania, Bulgaria, Albania and Poland were not included because they were satellite states, and not de facto Soviet Union members.